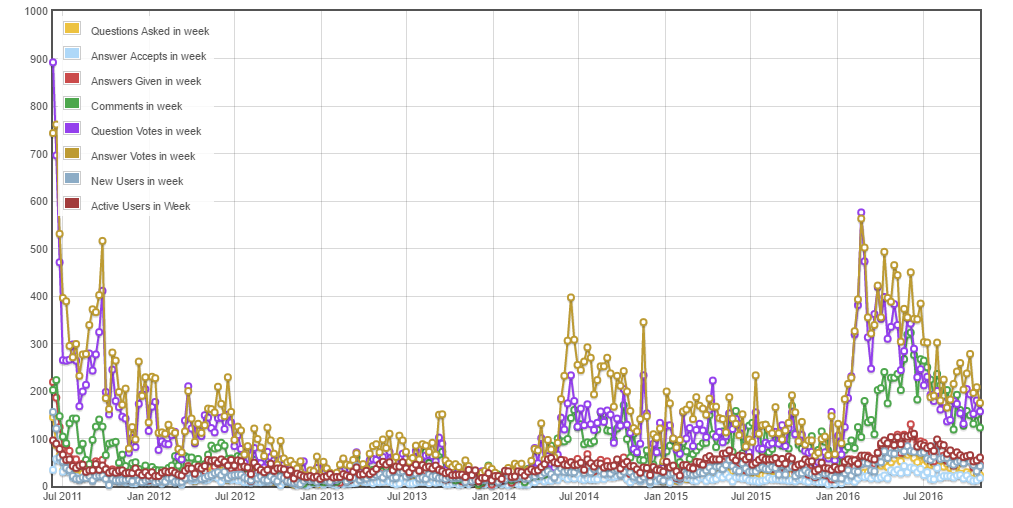
How do I go about getting a site activity graph, such as the one posted here:

2 Answers
Here ya go! For more detailed instructions, see below:
- Go to Stack Exchange Data Explorer
- Log in (optional)
- Enter 'site activity' in the search (top right)
- Click the 'favorite' or 'popular' tab
- Select the top result
- Choose your search parameters
- Begin entering 'gardening' into the 'switch sites' search, and select the proper site
- Press 'run query'.
- If you did not log in, enter a captcha
- Select the 'graph' option
- To save a graph, take a screenshot, and crop the shot using a photo editor
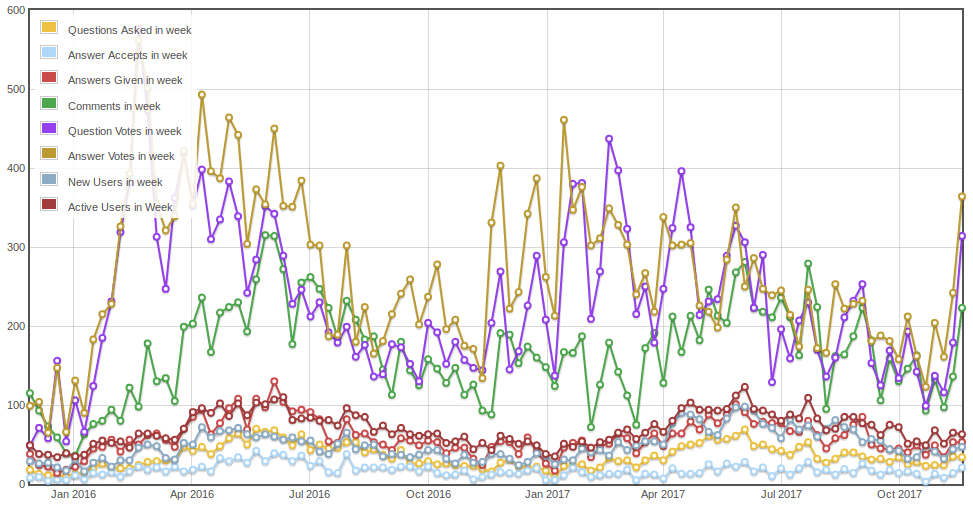
Just for reference, posting the result of the query from the previous answer (for last 104 weeks, or two years):
-
Hi VividD! Thanks for doing this. It's really helpful. Is there any way that you could do it again without the box up in the left side and replace this picture? That box is covering up the guide to which color the top three stats are. It's not a huge deal because we can look up at the information from @J. Musser's graph. If it would be easy for you to do though, it would be appreciated! Commented Nov 11, 2017 at 22:12
-

